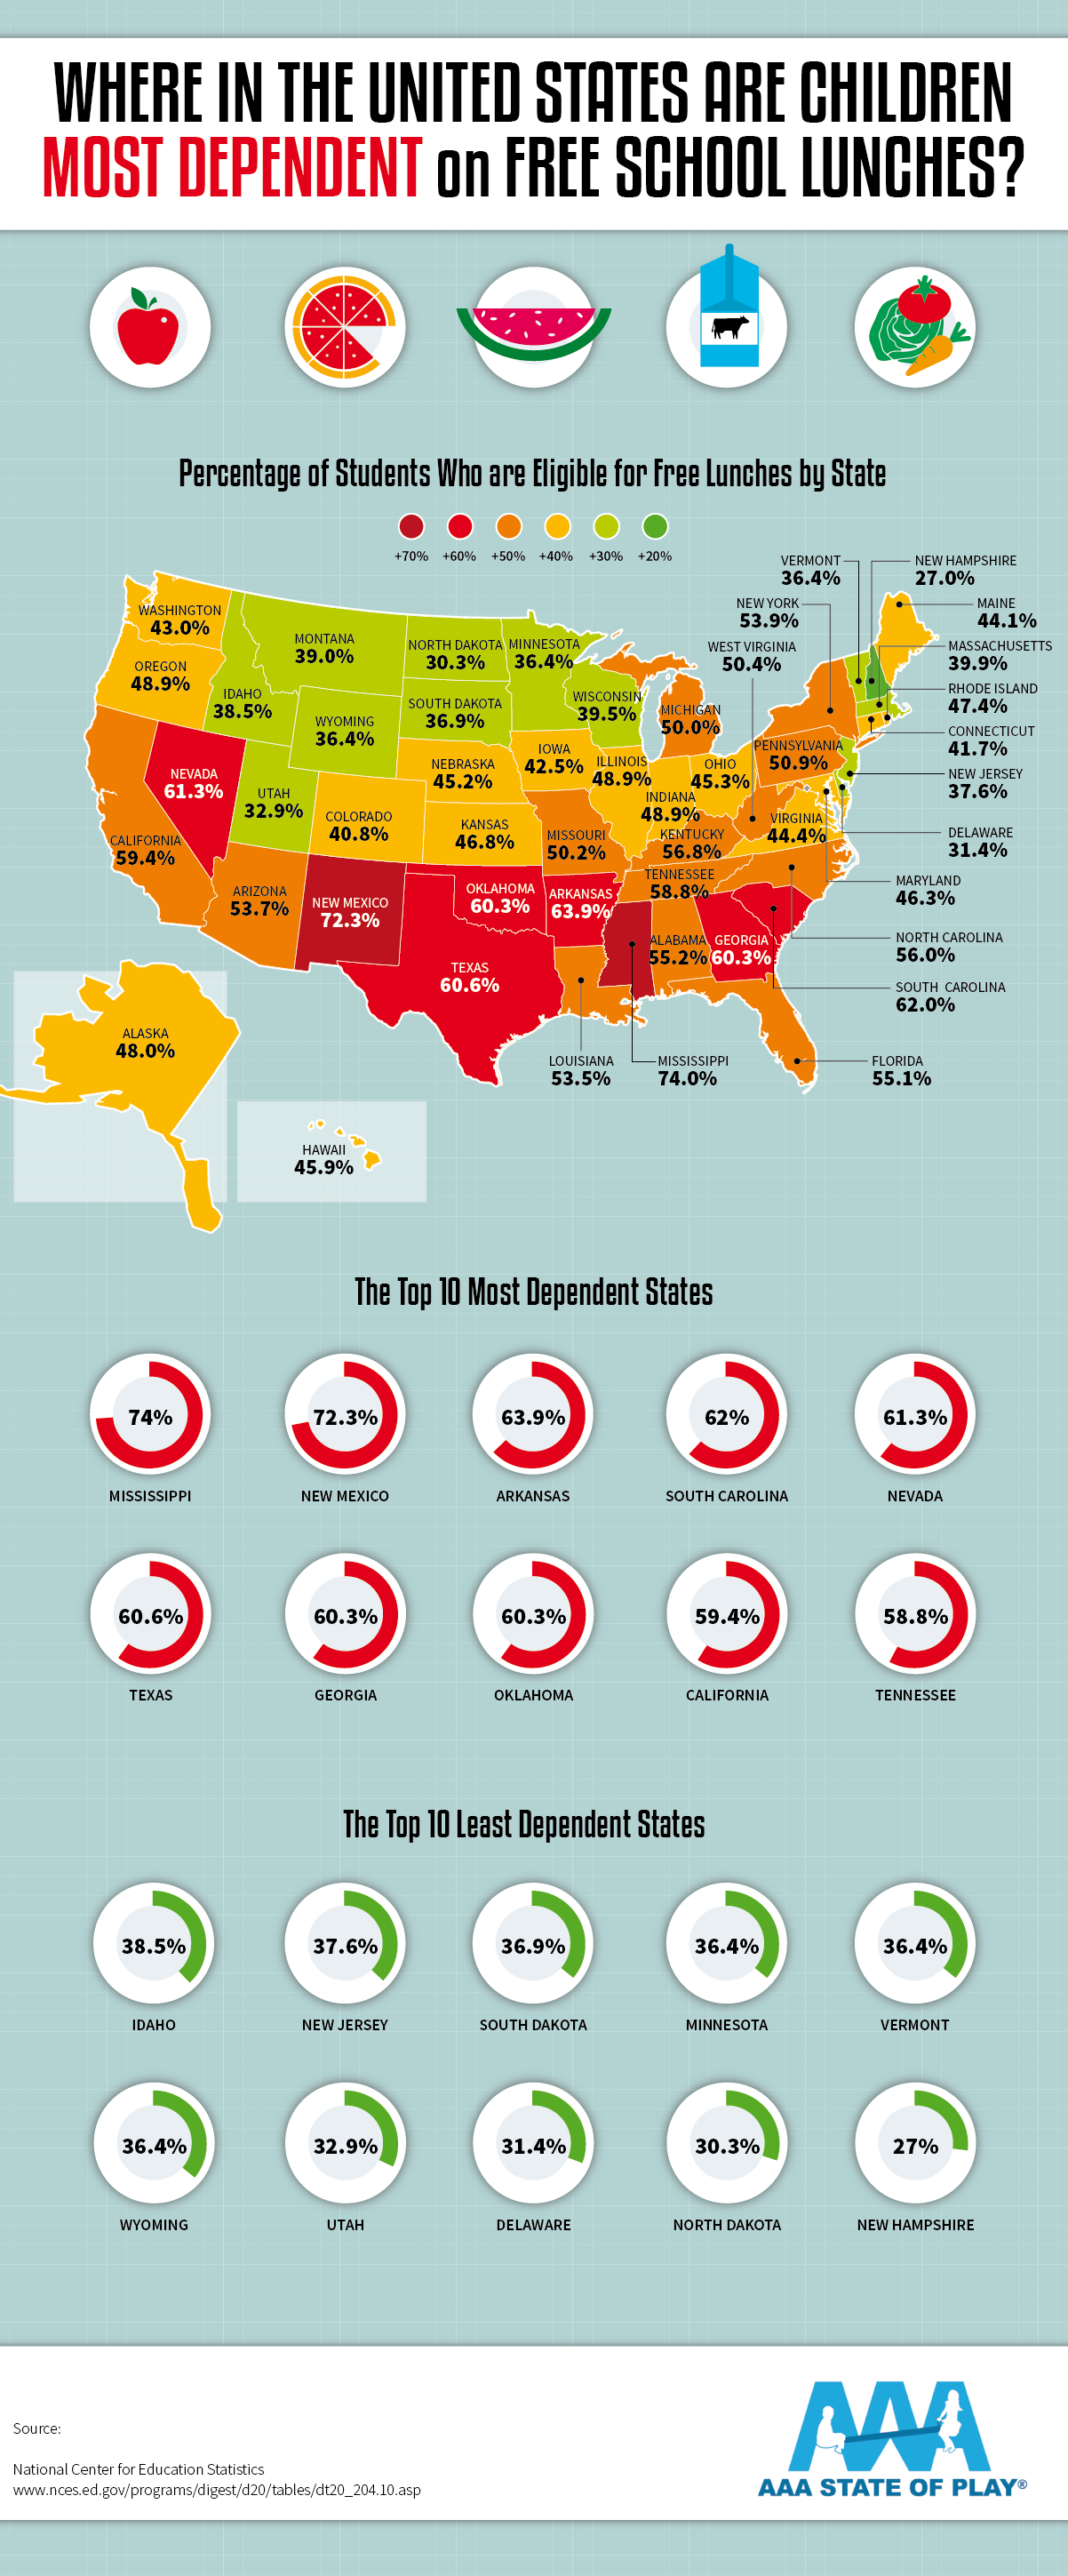
Where in the United States Are Children Most Dependent on Free School Lunches?
It can be shocking to think about how many kids go hungry in America, especially when the United States has a reputation for massive portion sizes, extravagant buffets, and fast-food restaurants at every corner. How many children go hungry in the U.S. each year? According to Save the Children, 17 million children struggle with hunger in the United States, which is 6 million more than before the pandemic. One way that the United States tackled this pressing issue is by offering free meals to all students through the National School Lunch Program, but this measure is set to expire by the end of June 2022. The team at AAA State of Play Playgrounds conducted a study to determine how many students get free lunch in America by state, using pre-pandemic data to highlight in which areas families may need the most assistance if the program ends.
Embed this image on your site:
What Is the National School Lunch Program?
The National School Lunch Program is a federally funded meal program serving public and nonprofit private schools and residential child care institutions. It offers free or low-cost meals each school day that are nutritionally balanced, enabling children to have healthy meals when they may be hard to come by at home. The program was established through the National School Lunch Act, which was signed by President Harry Truman in 1946.
How Many Kids Are on Free or Reduced Lunch in the U.S.?
In 2020, the National School Lunch Program provided around 22.6 million children with free school lunches or reduced school lunches.
Who Is Eligible for Free School Lunches?
Outside of the pandemic measures, National School Lunch Program eligibility has been determined by several factors. If you’re wondering, “Is my child eligible for free school meals?” the first step is to determine whether your child’s school participates in the program. If they do, who qualifies for free lunch depends on household income. Here is a rundown of free school lunch eligibility:
- Children in households with incomes at or below 130 percent of the federal poverty level can receive free school meals.
- If your household income is between 130 and 186 percent of the federal poverty level, your children can receive reduced-price school meals, which means they can be charged no more than 30 cents for breakfast and 40 cents for lunch.
- Children in households that receive Supplemental Nutrition Assistance Program benefits, Temporary Assistance for Needy Families benefits, and Food Distribution Program on Indian Reservation benefits can get free lunches.
- Foster youth; homeless, migrant, or runaway youth; or Head Start participants may receive free school lunches by default.
Here is a collection of resources for free food for children if you or someone you know is in need of food assistance programs to ensure healthy nutrition for kids:
- Free Meals Finder for Kids — No Kid Hungry
- Assistance for Children From Kindergarten to 12th Grade — USDA Food and Nutrition Service
- Food Assistance Resources — USA.gov
- Food Assistance Programs — Nutrition.gov
- Special Supplemental Nutrition Program for Women, Infants, and Children (WIC) — USDA Food and Nutrition Service
- United Way 211 (service that connects you to local food assistance programs and other resources)
- Summer Food Service Program — USDA Food and Nutrition Service
- FoodFinder (map of food pantries nationwide)
- The Emergency Food Assistance Program — USDA Food and Nutrition Service
- Find Your Local Food Bank — Feeding America
- Find a Free Meal Site — Child Nutrition Outreach Program
- Find Meals for Kids When Schools Are Closed — USDA Food and Nutrition Service
Percentages of Children Who Rely on Free School Lunches by State
State | Percentage (%) |
Alabama | 55.2 |
Alaska | 48.0 |
Arizona | 53.7 |
Arkansas | 63.9 |
California | 59.4 |
Colorado | 40.8 |
Connecticut | 41.7 |
Delaware | 31.4 |
Florida | 55.1 |
Georgia | 60.3 |
Hawaii | 45.9 |
Idaho | 38.5 |
Illinois | 48.9 |
Indiana | 48.9 |
Iowa | 42.5 |
Kansas | 46.8 |
Kentucky | 56.8 |
Louisiana | 53.5 |
Maine | 44.1 |
Maryland | 46.3 |
Massachusetts | 39.9 |
Michigan | 50.0 |
Minnesota | 36.4 |
Mississippi | 74.0 |
Missouri | 50.2 |
Montana | 39.0 |
Nebraska | 45.2 |
Nevada | 61.3 |
New Hampshire | 27.0 |
New Jersey | 37.6 |
New Mexico | 72.3 |
New York | 53.9 |
North Carolina | 56.0 |
North Dakota | 30.3 |
Ohio | 45.3 |
Oklahoma | 60.3 |
Oregon | 48.9 |
Pennsylvania | 50.9 |
Rhode Island | 47.4 |
South Carolina | 62.0 |
South Dakota | 36.9 |
Tennessee | 58.8 |
Texas | 60.6 |
Utah | 32.9 |
Vermont | 36.4 |
Virginia | 44.4 |
Washington | 43.0 |
West Virginia | 50.4 |
Wisconsin | 39.5 |
Wyoming | 36.4 |
Top 10 Most Dependent States
State | Percentage (%) |
Mississippi | 74.0 |
New Mexico | 72.3 |
Arkansas | 63.9 |
South Carolina | 62.0 |
Nevada | 61.3 |
Texas | 60.6 |
Georgia | 60.3 |
Oklahoma | 60.3 |
California | 59.4 |
Tennessee | 58.8 |
Top 10 Least Dependent States
State | Percentage (%) |
Idaho | 38.5 |
New Jersey | 37.6 |
South Dakota | 36.9 |
Minnesota | 36.4 |
Vermont | 36.4 |
Wyoming | 36.4 |
Utah | 32.9 |
Delaware | 31.4 |
North Dakota | 30.3 |
New Hampshire | 27.0 |
Brought to you by AAA State of Play commercial playground structures and swing sets.
Find more about the author: Kim Hart


